The Raob Parameter Metric - RPM
RPM provides a customized, single-value indicator of your sounding's total severe weather potential.

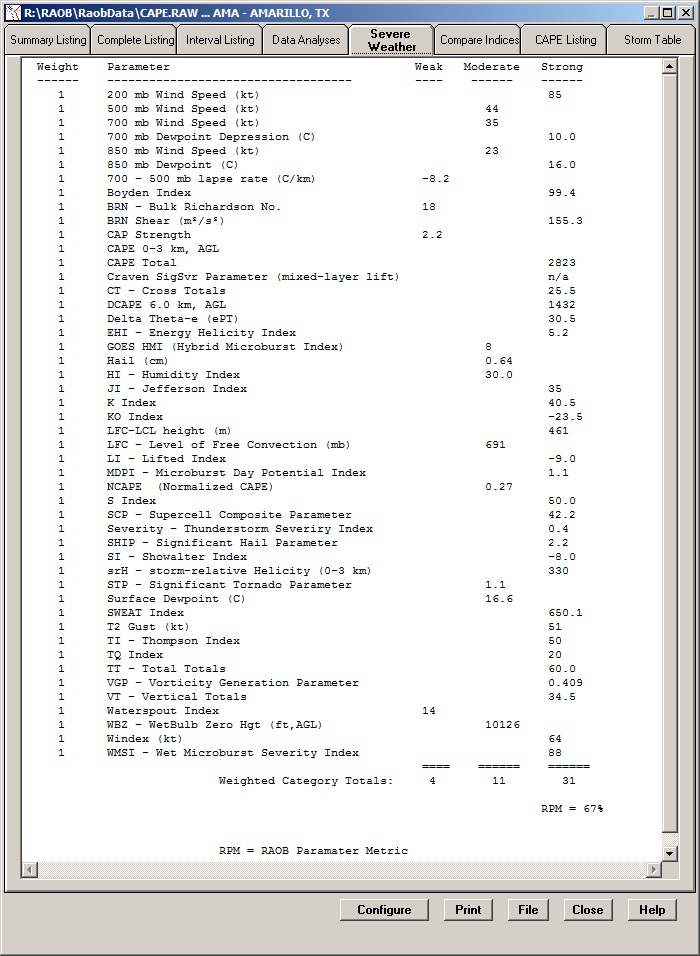
The RPM value ranges from 0 to 100%. It represents the percentage of RAOB's severe weather parameters that meet the "Strong" category. The Storm Category nomogram (as seen to the right) displays the weighted results of the three overall categories: Weak, Moderate, and Strong. The example RPM = 67% indicates that 67% of RAOB's severe weather parameters met the "Strong" threshold. See video
The Storm Category nomogram is a consolidation of all individual storm related indices and parameters, which can be individually configured via the Severe Weather Table Configuration Options screen. The individual severe weather parameters can be viewed using RAOB's Listings menu via the Severe Weather tab. The RPM value is also displayed at the bottom of this listing. If you tailor each of the 48 storm parameters for your specific location and season, then the consolidated RPM value will become an extremely valuable measure of severe weather potential. See video

Severe Weather sounding image. Click to enlarge.
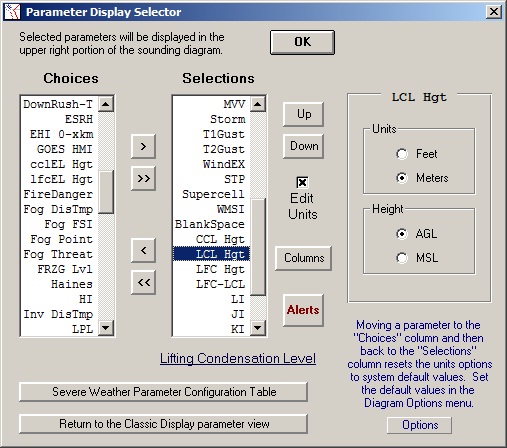
The Severe Weather sounding image to the right shows a composite view of RPM displays. It is shown in the Storm Category nomogram at the lower left as explained in the above nomogram image. The RPM value can also be configured for a display in the sounding's embedded custom data listing, which is seen in the sounding image's upper-right corner. The custom data display is activated from the sounding diagram's configuration screen, where the Parameter Display Selector permits the creation of a customized data listing of over 100 indices and parameters. Many of the 100+ indices can be individually configured for units and data mode. See video
The RPM value can also be plotted on the Cross-Section's "Meteogram" format. This can provide an excellent graphic image of storm potential for either Cross-Sections or Time-Height diagrams.