Mixing Height and the PBL
(Planetary Boundary Layer)
RAOB can identify the PBL's Mixing Height by one of, or any combination of, 4 methods:
- 1. The Holzworth Method
- This is the standard Theta-based method, where the surface parcel is lifted dry-adiabatically until it intersects the sounding profile. If a surface inversion exists, then the PBL height is defined at the top of the surface inversion. If no PBL can be identified and an elevated inversion exists, then the PBL height is identified at the base of the lifted inversion, as long as it is below a user-defined limit (typically 4 km, AGL).
- 2. The Stull Method
- This is similar to the above standard Theta-based method, but it instead uses the sounding's surface virtual potential temperature parcel with respect to intersecting the sounding's virtual temperature profile.
- 3. The Heffter method
- There are 2 stages to this method. Stage 1. First find the "critical inversion" using Theta gradients, where the Theta gradient must be at least 0.005 K/m and the temperature difference between the top and bottom of the gradient must be at least 2 K. Then the PBL height is located by finding the point in the Theta inversion where the temperature is 2 K warmer than at the base of the inversion. If the Heffter method fails to find a PBL Mixing Height, then Stage 2 is used. Stage 2. The PBL height is defined where the potential temperature gradient is a maximum, as defined within the user-defined height limit.
- 4. The Q (or Specific Humidity) method
- The PBL height is defined where the specific humidity gradient is a minimum, as defined within the user-defined height limit.
The user can select one, two three, or all four PBL methods via program configuration options. If two or more methods are selected, then the results are averaged and individual heights are listed on a separate data display.
How RAOB can graph and display PBL data
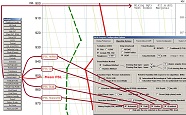
The above example sounding diagram shows the results of selecting the ANALYZE Toolbar's "Mixing Height" options. Not only is the main Mean Mixing Height plotted, but also the 4 individual PBL methods (Holzworth, Stull, Heffter, and Q). In this case all 4 methods were selected in the Program Configuration screen, so the plotted Mean Mixing Hgt is the average of all 4 methods. Also note that another configuration option restricts plotting of only the one selected or averaged PBL level.
Additional PBL related information can be displayed in text format as shown in the upper-right corner of the sounding diagram. Using the PARAMETER DISPLAY SELECTOR, the below 4 parameters (and many others) can be displayed on the diagram:
- Mixing Height
- Transport Mean Wind
- Transport Peak Wind
- Ventilation Index
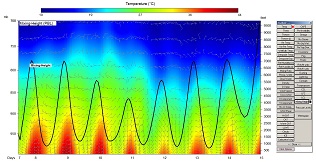
The above example time-section diagram displays the Mixing Height (PBL) over a colorized Temperature analysis (with winds plotted in gray). This example clearly shows how the PBL height changes in response to diurnal temperature changes.
Then automatically apply a maximum surface temperature
RAOB's new Maximum Surface Temperature option permits quick and easy sounding modification to examine afternoon convective potential, where the PBL and all other indices are automatically adjusted and displayed. Maximum temperature calculations are controlled by an advanced set of configuration options which include Clouds, Winds, and Seasons.

