Severe Weather Table
Configuration Options
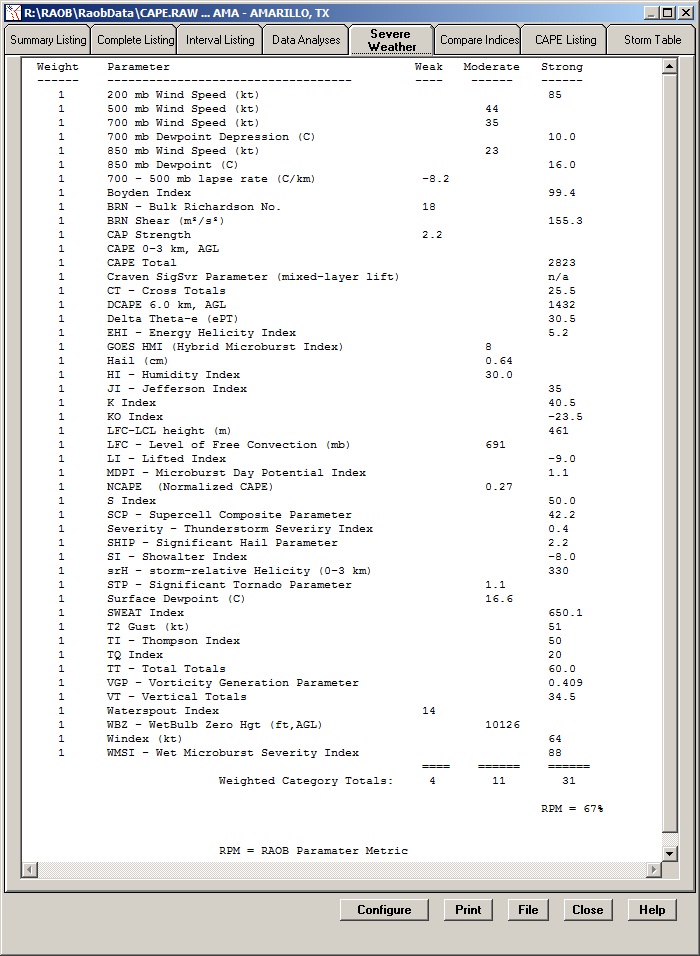
This table requires use of the optional Analytic program module. This unique table allows RAOB users to tailor 52 key atmospheric parameters to local specifications. The user can specify parameter threshold conditions with respect to 3 categories (weak, moderate, and strong). Each parameter can also be weighted (0 to 10) to best reflect local needs. These parameters can be displayed in the upper-right corner of the plotted sounding diagram. The RAOB program automatically produces a weighted summary listing, which can be printed or saved to file. See video


Storm Category graph
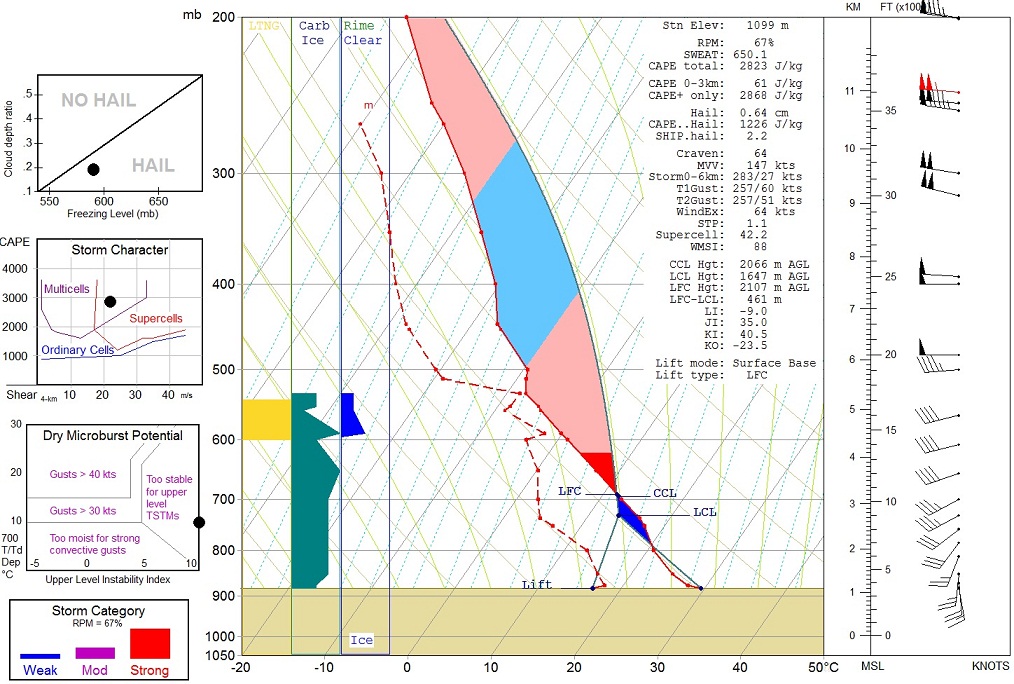
To the right is an example of the Storm Category graph, which is displayed on RAOB’s Severe Weather Display screen. This chart is a graphical summary of the above table’s parameters. This display is especially useful when using RAOB’s optional Interactive Module, as the chart is continually updated while the sounding data is altered. The RPM (Raob Parameter Metric) is also displayed for convenience.